fedulov.vitali@gmail.com,
The image comparison algorithm I developed for the service makes use of perceptual similarity by performing the following set of operations:
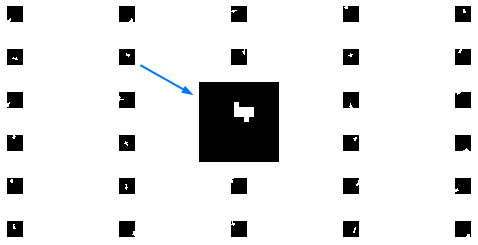
A set of square masks is generated. A mask is a black square image with several white pixels aggregating locally. Such pixel groups are located in distinct positions from mask to mask. The white pixels define image sub-regions to calculate average color at each of the regions. Such color values will be used during comparison stage. Depending on implementation the number of masks is 300-500, and the mask size ranges from 8x8 to 24x24 pixels.
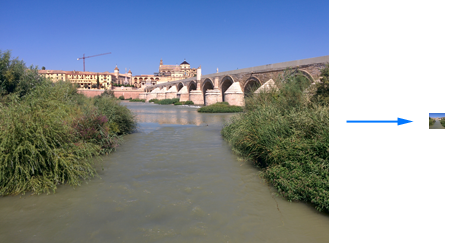
Input images are resized to the mask size. Resampling quality should be high enough in order to preserve near exact average colors in sub-regions of high-resolution input images. Low quality resampling would cause the algorithm to fail.
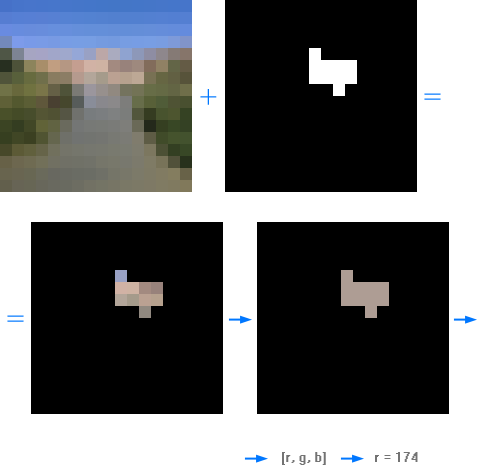
An image hash is an array of average color values defined by white pixels of separate masks superimposed over the resized image. Example hash: [23, 126, 77, ...], where the array length is equal to the number of masks. Each value in the array corresponds to an average color value corresponding to the location of white pixels in one mask. Black pixels of a mask are not used for calculations. Best results are achieved by mixing color channel values, so that each value corresponds to a different color channel in the following order within the hash: [red, green, blue, red, green, blue, ...].
An input to this operation is a pair of image hashes and original image sizes. Image sizes are used as a first step to quickly eliminate possible mismatch. If image proportions are considerably different, images are considered non-similar, so no further checks are performed.
In the next step two image hashes are compared by Euclidean distance. If the distance is larger than a certain threshold, images are considered non-similar. This comparison is done for both original and min-max-normalized hashes.
In the last step the hashes are cross-checked by brightness change sign, because similar pictures have closely correlated brightness changes between their sub-regions. This is the final step of the comparison procedure.
Image pairs that passed all the three filters above are similar (with high probability).
Optimization 1: To increase precision of the algorithm, one may apply it on image sub-regions (instead of the whole image). When majority of sub-regions are found to be similar, the images are likely to be similar.
Optimization 2: Surprisingly robust results were achieved when using exclusively the brightness correlation filter (as in part 4 above) performed on each-to-each sub-region. In fact, an additional similarity-dimension can be added to identify image pairs of large brightness/exposure differences. For example two photos of same subject: one underexposed, another normally exposed. Unfortunately such method is very slow compared to the Euclidean distance test. To accelerate the main algorithm such comparison is only done for adjacent hash values.
Optimization 3: If searching for very similar images, e.g. strictly resized images, one can modify threshold coefficients; alternatively increase mask size. In general, assuming same size of white sub-regions of the masks, smaller masks allow better generalization, e.g. comparing overall color/brightness distribution over the images. But such approach will also generate more false positives.
Optimization 4: Resizing input images to a square mask causes proportion changes for non-square images and allows to preserve information from every region of an image. Such resizing is optional. Instead it is possible to use/resize only the central square area of the input image for comparison, thus discarding information outside the central square. This should not cause considerable loss in comparison precision.
Optimization 5a: In addition to color values for hash generation it is also possible to use filter-based values, e.g. by passing an image through an edge detector. This allows to count additional visual signals within mask sub-regions. For example a forest photo will have distinct edge values compared to some smooth background of the same color (because trees have leaves, thus many edges). Such approach allows to distinguish textures. The challenge is finding the optimal coefficient for perceptual significance of edge information vs. color information during the comparison.
Optimization 5b: Instead of summation of colors within mask sub-regions, it is possible to sum over features extracted with convolutional neural network filter layers.
Optimization 6: In the algorithm mask sub-regions form small near circular areas. Instead it is possible to use more complex subject-specific shapes. E.g. face-like masks to detect faces. The mask summation regions can also have gray-scale values instead of being pure white.
Written in Golang image comparison (Github).
This is my original research. Please treat it as such for references, provided you do not find an earlier similar research by others, which is possible. Sometimes solutions have to be rediscovered, because either papers are hard to find, or they are difficult to understand.